
GWP* More Useful in Measuring Warming Cause by Livestock Methane Emissions
New study uses case studies from the California Dairy sector to show GWP* is a better tool for quantifying methane in emissions inventories
Quick Facts:
- First work to apply GWP* to sectoral emissions from a North American animal production system.
- Serves as case study for the application of GWP* to smaller industry- and locale-specific CH4 emissions data.
- GWP* matches the dynamics of warming from declining background CH4 emissions better than GWP-based emissions. In other words, GWP* can capture the physical relationship linking cumulative CO2 emissions and temperature change that GWP does not.
- Study finds that conventional GWP underrepresents the warming impacts of California dairy methane emissions under increasing emissions rates and overrepresents their warming impacts under declining emissions rates
- GWP* represents that when emissions are declining, cumulative California dairy methane decreases and warming forced by these emissions also decreases. However, any methane that continues to be emitted is still a strong climate forcer.
When it comes to assessing atmospheric warming from methane – animal agriculture’s major greenhouse gas – a relatively new metric known as GWP* better reflects the impact aggressive mitigation in California’s dairy sector can have on climate change.
Read the paper
In a CLEAR Center paper recently published in Frontiers in Sustainable Food Systems, more commonly known as Frontiers, authors Eleanor Pressman, Shule Liu and Frank Mitloehner of University of California, Davis compare how GWP* and the more commonly used GWP100 measure up to a climate model, that models warming caused by the same methane emissions. The research shows that GWP* is more in line with temperature change affected by estimated methane emissions than GWP100 in certain situations, meaning that to fully understand how methane impacts global warming and understand it in relation to other greenhouse gases, it’s a metric worth using.
“What is important about this work, is that it shows that GWP* aligns very well with a modeled warming scenario, better reflecting the impact livestock’s greenhouse gas emissions have on climate change,” Mitloehner said. “With GWP100, any reductions in methane showed more warming. But that doesn’t make sense, given that we know methane is naturally removed from the atmosphere in about 10-12 years. GWP* gets it right, showing the relationship between emissions and temperature. If we increase methane, we increase warming. If we reduce methane, we slow global warming.
“This work reinforces that our belief that aggressive methane reductions by the California dairy sector can impact atmospheric temperatures in a good way.”
Using GWP*, a newer system of measurement formulated at University of Oxford’s Oxford Martin School, researchers compared methane emissions from California lactating dairy cows when given by GWP with those given by GWP* under business-as-usual and reduction scenarios.
What makes their work significant is that it marks the first time scientists have used the novel GWP* to understand sectoral emissions from a North American animal production system. Until now, GWP* has been applied to large RCP-based methane and European and Australian agricultural methane datasets only. According to Pressman, GWP* is a better tool for quantifying methane in emissions inventories because it allows for more accuracy when comparing different greenhouse gases.
“People know that methane is a ‘stronger’ greenhouse gas than CO2, because its GWP100 is 25 times that of carbon dioxide. GWP100 captures this short-term strong warming that methane affects. However, methane has a shorter lifetime than CO2, so it’s not 25 times stronger than CO2 forever—it’s a stronger climate forcer in the short term and a weaker one in the long term,” Pressman said. “When we create emissions inventories that compare all of the different greenhouse gases, we need a ‘common unit’ in order to compare apples to apples, and because CO2 is quantitively the most important greenhouse gases, we convert other greenhouse gases to CO2 equivalents using GWP100. This study shows that GWP* may be a better conversion factor than GWP100 because it’s able to represent how methane is different from carbon dioxide. That would allow us to more accurately characterize emissions from the California dairy industry.”
Furthermore, this study shows GWP* is in better agreement with the modeled warming impacts of each annual CH4 emissions scenario in the various case studies, while GWP100 is less aligned with the predicted warming from the same emissions-based climate model. In short, GWP* can lead scientists and policy makers to better characterize methane emissions in terms of their temperature impacts.
GWP has been the go-to metric for climate scientists since it was formulated approximately 30 years ago. To its credit, it sets up comparisons between the global warming impacts of different gases, measuring how much energy the emissions of a gas will add to the Earth over a given period of time – often 100 years – relative to the same amount of emissions of carbon dioxide, the metric’s reference gas.
However, as the authors and others point out, there is no room in GWP to account for methane’s short life span and the resulting atmospheric removal of it. Methane is short-lived in the atmosphere, so there are removal processes that remove methane from the atmosphere. This means that if emissions rates of methane now are the same as they were about 12 years ago, there is no net addition to methane in the atmosphere and ongoing methane emissions don’t add extra warming.
Think of methane like filling a bathtub without the plug—if the water comes in at the same rate that it drains, the water won’t fill up. The water will only accumulate if the water flows in faster than it drains. Carbon dioxide, on the other hand, is more like filling up a tub with the plug in. Even if we turn off the tap, the water stays in the tub, or CO2 stays in the atmosphere. So GWP100 treats methane like it’s a gas that stays in the atmosphere and heats the Earth forever, even though it really only adds more heat when methane is emitted faster than it was about 12 years ago—if you turn up the tap. GWP* is a modified version of GWP which allows the same comparison between different GHG’s. The difference between GWP and GWP*, however, is that GWP* considers an increase in the emission rate –how fast the water is flowing into the tub – of short-lived greenhouse gas, such as methane, to be equivalent to a one-off pulse emission of CO2. It does not consider a pulse of methane to be equivalent to a pulse of CO2, as in GWP100.
That flaw in GWP has led to an overstatement of methane’s warming impact by as much as three to four times over a 20-year time period and an understatement of its impact by as much as four to five times for new methane emissions. The flaw is especially pronounced in the case of declining methane emissions, when water “drains from the tub.” That’s not to say methane is irrelevant. It is a potent greenhouse gas in the short term (any water remaining in the tub is methane that causes global warming), and researchers are right to call for the California dairy sector to continue to work on reducing its emissions, advocating for the use of GWP* to monitor progress.
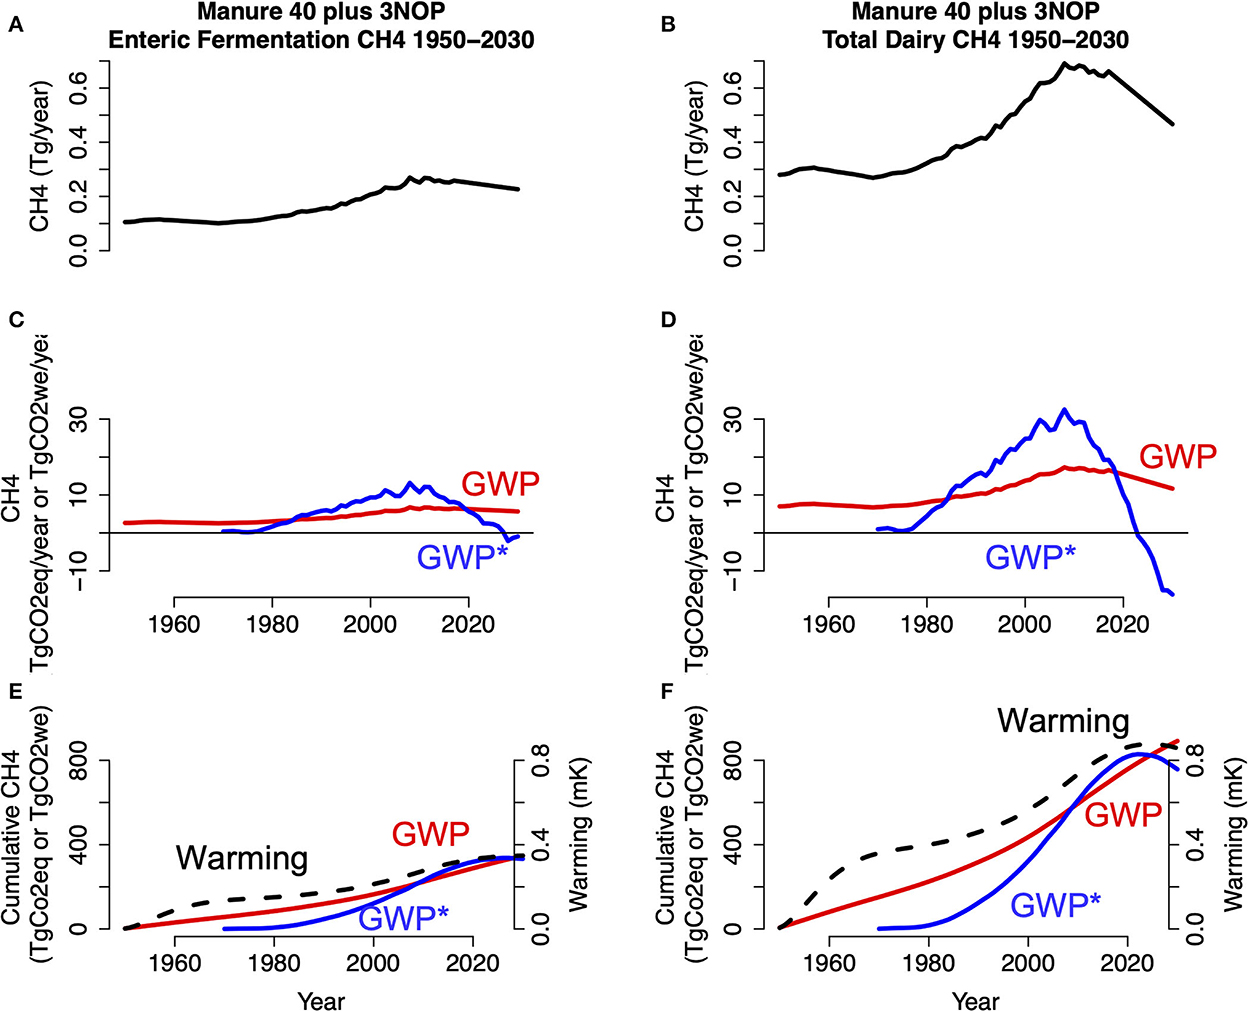
Using both GWP and GWP*, the researchers laid out three scenarios for the dairy sector: methane emissions would continue on the same trajectory (business as usual), methane emissions from manure would be reduced by 40% but enteric emissions would continue as usual; and finally, a 40% reduction in methane emissions from manure and reductions in enteric methane emissions due to feeding cows the maximum amount of 3NOP or 3-Nitrooxypropanol, a food additive that inhibits methane production in ruminant animals.
In the first and second California dairy case studies, GWP* showed higher methane emissions than GWP when methane emissions were increasing, but lower methane emissions than GWP as methane emissions decreased. In the third scenario, the most aggressive plan to reduce methane emissions, annual GWP* estimates were negative, so cumulative methane emissions decreased – but were still positive, indicating positive warming, just less warming relative to peak warming year. These results show that GWP* was able to represent how methane does not accumulate under declining emissions rates, which GWP does not show.
Although warning against any metric that oversimplifies the complicated business of greenhouse gas emissions and global warming, the researchers conclude GWP* is more accurate than GWP in comparing methane to other pollutants and trying to characterize warming from methane.
“It is a more reliable measure of the warming of methane when the goal is to reduce emissions,” Mitloehner said.
To read the article, visit Frontiers.
Media Resources
For media inquires, contact Joe Proudman at [email protected].